29 Jan 2014
Ruby 2.1’s GC is better than ever, but ruby still uses a stop-the-world GC implementation. This means collections triggered during request processing will add latency to your response time. One way to mitigate this is by running GC in-between requests, i.e. “Out-of-Band”.
OOBGC is a popular technique, first introduced by Unicorn and later integrated into Passenger. Traditionally, these out-of-band collectors force a GC every N requests. While this works well, it requires careful tuning and can add CPU pressure if unnecessary collections occur too often.
In kiji (twitter’s REE fork), @evanweaver introduced GC.preemptive_start as an alternative to the “every N requests” model. This new method could make more intelligent decisions about OOBGC based on the size of the heap and the number of free slots. We’ve long used a similar trick in our 1.9.3 fork to optimize OOBGC on github.com.
When we upgraded to a patched 2.1.0 in production earlier this month, I translated these techniques into a new OOBGC for RGenGC. Powered by 2.1’s new tracepoint GC hooks, it understands both lazy vs immediate sweeping and major vs minor GC in order to make the best descision about when a collection is required.
Using the new OOBGC is simple:
require 'gctools/oobgc'
GC::OOB.run() # run this after every request body is flushed
or if you’re using Unicorn:
# in config.ru
require 'gctools/oobgc'
if defined?(Unicorn::HttpRequest)
  use GC::OOB::UnicornMiddleware
end
OOBGC results

With ruby 2.1, our average OOBGC pause time (`oobgc.mean`) went from 125ms to 50ms thanks to RGenGC. The number of out-of-band collections (`oobgc.count`) also went down, since the new OOBGC only runs when necessary.

The overall result is much less CPU time (`oobgc.sum`) spent doing GC work between requests.
GC during requests

After our 2.1 upgrade, we’re performing GC during requests 2-3x more often than before (`gc.time.count`). However since all major collections can happen preemptively, only minor GCs happen during requests making the average GC pause only 25ms (`gc.time.mean`).

The overall result is reduced in-request GC overhead (`gc.time.sum`), even though GC happens more often.
Note: Even with the best OOBGC, collections during requests are inevitable (especially on large requests with lots of allocations). The GC’s job during these requests is to control memory growth, so I do not recommend disabling ruby’s GC during requests.
30 Dec 2013
Ruby 2.1 adds a “restricted” generational collector, with minor mark phases that dramatically reduce the cost of GC.
Let’s take a look at the evolution of Ruby’s GC.
Ruby 1.8: simple mark and sweep
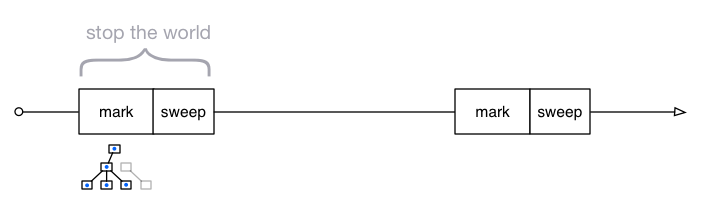
Classic mark and sweep implementation. The entire world is stopped during both phases.
- Traverse object graph from roots and mark live objects,
using a bit inside the object structure (FL_MARK).
- Iterate over all heap slots and add unmarked slots to the freelist.
Ruby 1.9.3: lazy sweep

@nari3 adds LazySweepGC, reducing GC pauses to just the mark phase. The heap is swept incrementally as object slots are required.
Ruby 2.0: bitmaps for COW-safety
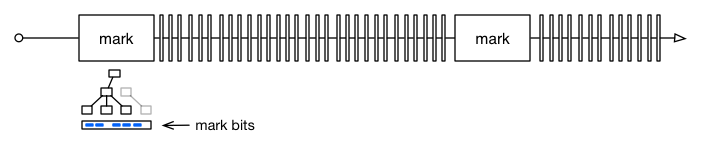
@nari3 adds Bitmap Marking GC, helping Unix systems share memory across child processes. The mark phase is also rewritten to be non-recursive.
Although the memory savings from bitmaps were only modest, the patch freed up a bit (FL_MARK became FL_WB_PROTECTED later) and laid the groundwork for a generational collector.
Ruby 2.1: oldgen and minor marking
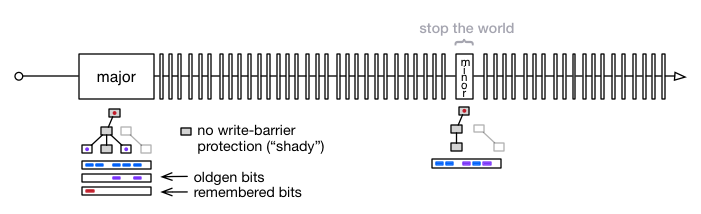
@ko1 designs RGenGC, a generational collector that can be implemented incrementally and supports C-extensions.
Objects on the heap are divided into two categories:
- protected by a write-barrier (
FL_WB_PROTECTED)
- unprotected (or “shady”)
- missing write-barrier (
Proc, Ruby::Env)
- unsafe access from C-extension (
RARRAY_PTR, RSTRUCT_PTR)
Only protected objects can be promoted to oldgen.
(This is the “restricted” in RGenGC.)
Unprotected objects cannot be promoted, but if referenced from oldgen they are added to a remembered set. Minor marks are much faster because they only have to traverse references from the remembered set.
Heap Layout
Ruby objects live on the ruby heap, which is split up into pages. Each page is 16KB and holds ~408 object slots.
Every RVALUE slot on this page occupies 40 bytes. Strings shorter than 23 bytes and Arrays with less than four elements can be embedded directly within this 40 byte slot.
GC::INTERNAL_CONSTANTS[:RVALUE_SIZE]    #=>  40 bytes per object slot (on x84_64)
GC::INTERNAL_CONSTANTS[:HEAP_OBJ_LIMIT] #=> 408 slots per heap page
Pages in the heap reside in one of two places: eden or tomb. Eden contains pages that have one or more live objects. The tomb contains empty pages with no objects. The sum of these pages represent the capacity of the ruby heap:
GC.stat(:heap_used) ==
  GC.stat(:heap_eden_page_length) + GC.stat(:heap_tomb_page_length)
During lazy sweep eden pages are swept one at a time. Each page provides up to 408 object slots for re-use. By the time the lazy sweep completes, all unmarked slots in eden have been replaced by new objects.
Empty pages found during sweep are moved to the tomb. This reduces fragmentation in eden (by filling in sparse pages first), and allows the tomb to be grown or shrunk before it is used.
Once eden runs out of slots, the empty pages in tomb are moved back to eden to add space. This happens incrementally, one page at a time. When the tomb runs out of pages, a mark is triggered and the cycle begins anew.
Major vs Minor GC
As an example, let’s look at github.com’s large rails app.
First, we’ll measure how many long-lived objects are created after the app is booted:
# preload controllers/models and other code
GitHub.preload_all

# measure heap stats after a major mark and full sweep
GC.start # same as GC.start(full_mark: true, immediate_sweep: true)

# three ways to measure live slots
count = ObjectSpace.count_objects
count[:TOTAL] - count[:FREE]        #=> 565121

GC.stat(:heap_live_slot)            #=> 565121

GC.stat(:total_allocated_object) -
GC.stat(:total_freed_object)        #=> 565121
Of these ~565k long-lived bootup objects, ~95% are promoted to oldgen:
s = GC.stat
100.0 *              s[:old_object] / s[:heap_live_slot]  #=> 94.90
100.0 * s[:remembered_shady_object] / s[:heap_live_slot]  #=>  1.88
This means only ~5% of the heap needs to be traversed on minor marks, via references from the ~2% of objects that are remembered.
As expected, this makes minor GC pauses much much shorter: only 7ms in our app compared to 58ms for a major mark.
time{ GC.start(full_mark:  true, immediate_sweep: false) }  #=> 0.058
time{ GC.start(full_mark: false, immediate_sweep: false) }  #=> 0.007
The majority of mark phases during code execution will use a minor mark and finish very quickly. However, over time the size of the remembered set and oldgen can grow. If either of these double in size, a major mark is used to reset them.
The limits used to trigger a major mark can be monitored via GC.stat:
>> GC.stat.values_at(:remembered_shady_object, :old_object)
=> [10647, 536785]

>> GC.stat.values_at(:remembered_shady_object_limit, :old_object_limit)
=> [21284, 1073030]
The frequency of major vs minor marks can also be monitored. For example, you might graph “major GCs per request”, “minor GCs per request” or “minor GCs per major GC”.
GC.stat(:count) == GC.stat(:minor_gc_count) + GC.stat(:major_gc_count)
Tuning Variables
In our app above, we use the following GC settings:
export RUBY_GC_HEAP_INIT_SLOTS=600000
export RUBY_GC_HEAP_FREE_SLOTS=600000
export RUBY_GC_HEAP_GROWTH_FACTOR=1.25
export RUBY_GC_HEAP_GROWTH_MAX_SLOTS=300000
-
RUBY_GC_HEAP_INIT_SLOTS: initial number of slots on the heap (default: 10000)
Our app boots with ~600k long-lived objects, so we use 600k here to reduce GC activity during boot.
-
RUBY_GC_HEAP_FREE_SLOTS: minimum free slots reserved for sweep re-use (4096)
Our servers have extra RAM, so we bump this up to trade off memory for time between GCs.
An average request allocates 75k objs, so 600k free slots gives us ~8 requests in between each mark phase.
-
RUBY_GC_HEAP_GROWTH_FACTOR: factor used to grow the heap (1.8x)
Since our heap is already quite big with the settings above, we reduce the growth factor (1.25x) to add slots in smaller increments.
-
RUBY_GC_HEAP_GROWTH_MAX_SLOTS: maximum new slots to add (no limit)
In addition to reducing the growth factor, we cap it so a maximum of 300k objects can be added to the heap at once.
malloc() Limits
So Ruby objects occupy 40 bytes each, inside pages on the eden heap.
When an object needs even more space, it allocates memory on the regular process heap (via a ruby_xmalloc() wrapper). For instance when a string outgrows 23 bytes, it allocates a separate, larger buffer for itself. The additional memory used by this string (or any object) can be measured with ObjectSpace.memsize_of(o) in objspace.so.
Internally the VM keeps track of malloc_increase, the number of bytes that have been allocated but not yet freed. This is effectively the memory growth of the process. When more than 16MB is added, a GC is forced even if free slots are still available. The limit starts at 16MB, but adapts to the memory usage patterns in your code.
The initial/max values and dynamic growth factor can also be controlled via environment variables:
RUBY_GC_MALLOC_LIMIT: (default: 16MB)RUBY_GC_MALLOC_LIMIT_MAX: (default: 32MB)RUBY_GC_MALLOC_LIMIT_GROWTH_FACTOR: (default: 1.4x)
Similarly, the memory growth associated with oldgen is tracked separately in oldmalloc_increase. When this limit is tripped, a major GC is forced. These limits can be tuned as well:
RUBY_GC_OLDMALLOC_LIMIT: (default: 16MB)RUBY_GC_OLDMALLOC_LIMIT_MAX: (default: 128MB)RUBY_GC_OLDMALLOC_LIMIT_GROWTH_FACTOR: (default: 1.2x)
Both malloc increase and limit values can be monitored via GC.stat:
>> GC.stat.values_at(:malloc_increase, :malloc_limit)
=> [14224, 64000000]

>> GC.stat.values_at(:oldmalloc_increase, :oldmalloc_limit)
=> [20464, 64000000]
In our app we’ve increased the initial limit to 64MB, to reduce GC activity during boot and when memory usage peaks.
export RUBY_GC_MALLOC_LIMIT=64000000
export RUBY_GC_OLDMALLOC_LIMIT=64000000
GC Events
And finally, ruby 2.1 ships with new tracepoints that can be used to monitor the GC at runtime.
These are available from C, via rb_tracepoint_new():
RUBY_INTERNAL_EVENT_GC_STARTRUBY_INTERNAL_EVENT_GC_END_MARKRUBY_INTERNAL_EVENT_GC_END_SWEEP
C-extensions using these events can also take advantage of rb_gc_stat() and rb_gc_latest_gc_info(), which provide safe access to GC.stat and GC.latest_gc_info.
Ruby 2.2 and beyond
With the introduction of RGenGC, Ruby 2.1 includes a significant upgrade to ruby’s GC. Seven millisecond minor marks and a 95% oldgen promotion rate are remarkable achievements, especially considering not one of our C-extensions had to be modified. Hats off to @ko1!
Ruby 2.2 will expand the GC algorithm from two generations to three. (In fact, 2.1 already includes a RGENGC_THREEGEN compile flag to enable the third generation). @ko1 also plans to implement an incremental mark phase, which would remove the need for long major GC pauses.
26 Dec 2013
ObjectSpace in ruby contains many useful heap debugging utilities.
Since 1.9 ruby has included objspace.so which adds even more methods to the ObjectSpace module:
ObjectSpace.each_object{ |o| ... }
ObjectSpace.count_objects #=> {:TOTAL=>55298, :FREE=>10289, :T_OBJECT=>3371, ...}
ObjectSpace.each_object.inject(Hash.new 0){ |h,o| h[o.class]+=1; h } #=> {Class=>416, ...}

require 'objspace'
ObjectSpace.memsize_of(o) #=> 0 /* additional bytes allocated by object */
ObjectSpace.count_tdata_objects #=> {Encoding=>100, Time=>87, RubyVM::Env=>17, ...}
ObjectSpace.count_nodes #=> {:NODE_SCOPE=>2, :NODE_BLOCK=>688, :NODE_IF=>9, ...}
ObjectSpace.reachable_objects_from(o) #=> [referenced, objects, ...]
ObjectSpace.reachable_objects_from_root #=> {"symbols"=>..., "global_tbl"=>...} /* in 2.1 */
In 2.1, we’ve added a two big new features: an allocation tracer and a heap dumper.
Allocation Tracing
Tracking down memory growth and object reference leaks is tricky when you don’t know where the objects are coming from.
With 2.1, you can enable allocation tracing to collect metadata about every new object:
require 'objspace'
ObjectSpace.trace_object_allocations_start

class MyApp
  def perform
    "foobar"
  end
end

o = MyApp.new.perform
ObjectSpace.allocation_sourcefile(o) #=> "example.rb"
ObjectSpace.allocation_sourceline(o) #=> 6
ObjectSpace.allocation_generation(o) #=> 1
ObjectSpace.allocation_class_path(o) #=> "MyApp"
ObjectSpace.allocation_method_id(o)  #=> :perform
A block version of the tracer is also available.
Under the hood, this feature is built on NEWOBJ and FREEOBJ tracepoints included in 2.1. These events are only available from C, via rb_tracepoint_new().
Heap Dumping
To further help debug object reference leaks, you can dump an object (or the entire heap) for offline analysis.
require 'objspace'

# enable tracing for file/line/generation data in dumps
ObjectSpace.trace_object_allocations_start

# dump single object as json string
ObjectSpace.dump("abc".freeze) #=> "{...}"

# dump out all live objects to a json file
GC.start
ObjectSpace.dump_all(output: File.open('heap.json','w'))
Objects are serialized as simple json, and include all relevant details about the object, its source (if allocating tracing was enabled), and outbound references:
{
 "address":"0x007fe9232d5488",
 "type":"STRING",
 "class":"0x007fe923029658",
 "frozen":true,
 "embedded":true,
 "fstring":true,
 "bytesize":3,
 "value":"abc",
 "encoding":"UTF-8",
 "references":[],
 "file":"irb/workspace.rb",
 "line":86,
 "method":"eval",
 "generation":15,
 "flags":{"wb_protected":true}
}
The heap dump produced by ObjectSpace.dump_all can be processed by the tool of your choice. You might try a json processor like jq or a json database. Since the dump contains outbound references for each object, a full object graph can be re-created for deep analysis.
For example, here’s a simple ruby/shell script to see which gems/libraries create the most long-lived objects of different types:
$ cat heap.json |
    ruby -rjson -ne ' puts JSON.parse($_).values_at("file","line","type").join(":") ' |
    sort        |
    uniq -c     |
    sort -n     |
    tail -4

26289 lib/active_support/dependencies.rb:184:NODE
29972 lib/active_support/dependencies.rb:184:DATA
43100 lib/psych/visitors/to_ruby.rb:324:STRING
47096 lib/active_support/dependencies.rb:184:STRING
If you have a ruby application that feels large or bloated, give these new ObjectSpace features a try. And if you end up writing a heap analysis tool or visualization for these json files, do let me know on twitter.
24 Dec 2013
Ruby 2.1 is shipping with rb_profile_frames(), a new C-api for fetching ruby backtraces. The api performs no allocations and adds minimal cpu overhead making it ideal for profiling, even in production environments.
I’ve implemented a sampling callstack profiler for 2.1 called stackprof with this API, using techniques popularized by gperftools and @brendangregg. It works remarkably well, and provides incredible insight into the execution of your code.
For example, I recently used StackProf::Middlware on one of our production github.com unicorn workers. The resulting profile is analyzed using bin/stackprof:
$ stackprof data/stackprof-cpu-4120-1384979644.dump --text --limit 4
==================================
  Mode: cpu(1000)
  Samples: 9145 (1.25% miss rate)
  GC: 448 (4.90%)
==================================
     TOTAL    (pct)     SAMPLES    (pct)     FRAME
       236   (2.6%)         231   (2.5%)     String#blank?
       546   (6.0%)         216   (2.4%)     ActiveRecord::ConnectionAdapters::Mysql2Adapter#select
       212   (2.3%)         199   (2.2%)     Mysql2::Client#query_with_timing
       190   (2.1%)         155   (1.7%)     ERB::Util#html_escape
Right away, we see that 2.6% of cpu time in the app is spent in String#blank?.
Let’s zoom in for a closer look:
$ stackprof data/stackprof-cpu-4120-1384979644.dump --method 'String#blank?'
String#blank? (lib/active_support/core_ext/object/blank.rb:80)
  samples:   231 self (2.5%)  /    236 total (2.6%)
  callers:
     112  (   47.5%)  Object#present?
  code:
                                  |    80  |   def blank?
  187    (2.0%) /   187   (2.0%)  |    81  |     self !~ /[^[:space:]]/
                                  |    82  |   end
We see that half the calls into blank? are coming from Object#present?.
As expected, most of the time in the method is spent in the regex on line 81. I noticed the line could be optimized slightly to remove the double negative:
   def blank?
-    self !~ /[^[:space:]]/
+    self =~ /\A[[:space:]]*\z/
   end
That helped, but I was curious where these calls were coming from. Let’s follow the stack up and look at the Object#present? callsite:
$ stackprof data/stackprof-cpu-4120-1384979644.dump --method 'Object#present?'
Object#present? (lib/active_support/core_ext/object/blank.rb:20)
  samples:    12 self (0.1%)  /    133 total (1.5%)
  callers:
      55  (   41.4%)  RepositoryControllerMethods#owner
      31  (   23.3%)  RepositoryControllerMethods#current_repository
  callees (121 total):
     112  (   92.6%)  String#blank?
       6  (    5.0%)  Object#blank?
       3  (    2.5%)  NilClass#blank?
  code:
                                  |    20  |   def present?
  133    (1.5%) /    12   (0.1%)  |    21  |     !blank?
                                  |    22  |   end
So Object#present? is almost always called on String objects (92.6%), with the majority of these calls coming from two helper methods in RepositoryControllerMethods.
The callers in RepositoryControllerMethods appeared quite simple, but after a few minutes of staring I discovered the fatal mistake causing repeated calls to present?:
    def owner
-    @owner ||= User.find_by_login(params[:user_id]) if params[:user_id].present?
+    @owner ||= (User.find_by_login(params[:user_id]) if params[:user_id].present?)
    end
This simple 2 byte change removed 40% of calls to String#blank? in our app. To further minimize the cost of String#blank? in our app, we switched to @samsaffron’s pure C implementation in the fast_blank gem.
The end result of all these optimizations was a dramatic reduction in cpu time (i.e. without idle time) spent processing requests:

With 2.1 and stackprof, it’s easier than ever to make your ruby code fast. Try it today!
23 Dec 2013
Custom proclines are a great way to add visibility into your code’s execution. The various BSDs have long shipped a setproctitle(3) syscall for this purpose. At GitHub, we use this technique extensively in our unicorns, resques and even our git processes:
$ ps ax | grep git:
32326  git:  upload-pack  AOKP/kernel_samsung_smdk4412  [173.x.x.x over git]  clone: create_pack_file: 75.27 MiB @ 102.00 KiB/s
32327  git: pack-objects  AOKP/kernel_samsung_smdk4412  [173.x.x.x over git]  writing: 9% (203294/2087544)
 2671  git:  upload-pack  CyanogenMod/android_libcore   [87.x.x.x over git]  clone: create_pack_file: 31.26 MiB @ 31.00 KiB/s
 2672  git: pack-objects  CyanogenMod/android_libcore   [87.x.x.x over git]  writing: 93% (90049/96410)

$ ps ax | grep unicorn
2408  unicorn github.com[9013677] worker[01]:  1843 reqs,  2.9 req/s,   23ms avg,   6.9% util
2529  unicorn github.com[9013677] worker[02]:  1715 reqs,  2.9 req/s,   21ms avg,   6.2% util
2640  unicorn github.com[9013677] worker[03]:  1632 reqs,  3.2 req/s,   19ms avg,   6.2% util

$ pstree -s resqued
─┬─ 25012 resqued-0.7.9 master [gen 413] [1 running] config/resqued.rb
 └─┬─ 21924 resqued-0.7.9 listener 413 [f48cb15] [running] config/resqued.rb
   ├─── 22329 resque-1.20.0: [f48cb15] Waiting for low,notifications,services
   ├─── 22295 resque-1.20.0: [f48cb15] Processing notifications since 1389929817: GitHub::Jobs::DeliverNotifications
Linux never gained a specialized syscall, but still supports custom /proc/pid/cmdline via one weird trick. The hack relies on the fact that execve(2) allocates a contiguous piece of memory to pass argv and envp into a new process. When the null byte separating the two values is overwritten, the kernel assumes you’ve customized your cmdline and continues to read into the envp buffer. This means your procline can grow to contain more information as long as there’s space in the envp buffer. (Environment variables are copied out of the original envp buffer, so overwriting this area of memory only affects /proc/pid/environ).
Starting with Ruby 2.1 Process.setproctitle is available as a complementary method to $0=, and can be used to customize proclines without affecting $0.